About proofs
Proofs
Information about the US and Dutch proof
About proofs
CRV USA offers a wide portfolio of genetic products from all over the world. When it comes to proofs that means that you may come across some values that look a bit different when evaluating our bulls.
On this page, we will offer you some information to help you understand and compare the Dutch vs. the US proof information.
Total Merit Indices
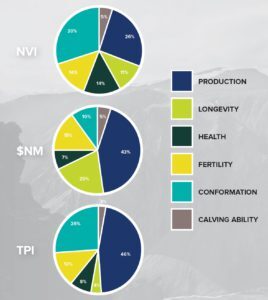
There are three large indices in The United States and The Netherlands. We have put NVI, $NM and TPI alongside each other for you so you can easily see which index puts emphasis on which traits.
NVI
The NVI is the total merit index that is used in the Netherlands and Flanders for ranking bulls with the aim of putting those bulls at the top that are able to produce daughters that come closest to the national breeding goal.
Using NVI in your breeding program will lead to:
- Improvement of production and longevity;
- Lower culling rates, which means fewer replacements and thus a higher income;
- More fertile and healthier cows, which will have a positive effect on income and consumer acceptance.
NVI is derived from a formula that takes into consideration three different components: production, health and conformation. Below the underlying traits are given en their contribution to the NVI.
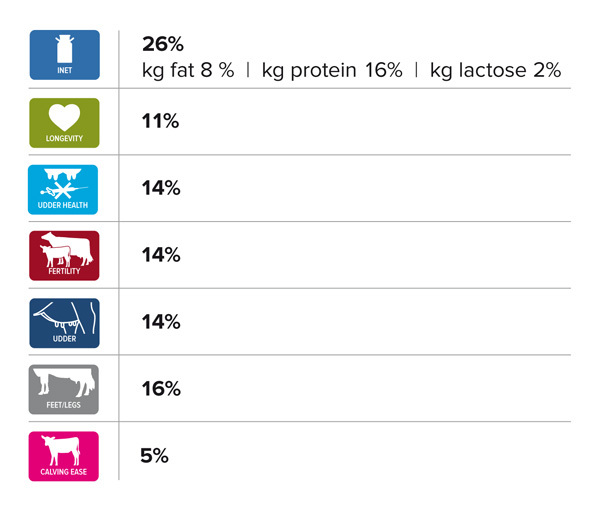
In the table below the genetic gain (in breeding values) from selection with NVI after 1 generation is given.
| Trait | Gain | Value |
|---|---|---|
| Fat | 13 | Kg |
| Protein | 8.7 | Kg |
| Lactose | 12.4 | Kg |
| Longevity | 200 | Days |
| Udder Health | 2.3 | Pnt |
| Udder | 1.8 | Pnt |
| Feet & Legs | 2.2 | Pnt |
| Calving interval | 0.8 | Pnt |
| Interval from first to last insemination | 1.0 | Pnt |
| Calving ease (paternal) | 1.4 | Pnt |
| Maternal calving process | 1.1 | Pnt |
| Vitality (paternal) | 0.7 | Pnt |
| Maternal vitality | 0.9 | Pnt |
Dutch vs US Type proofs
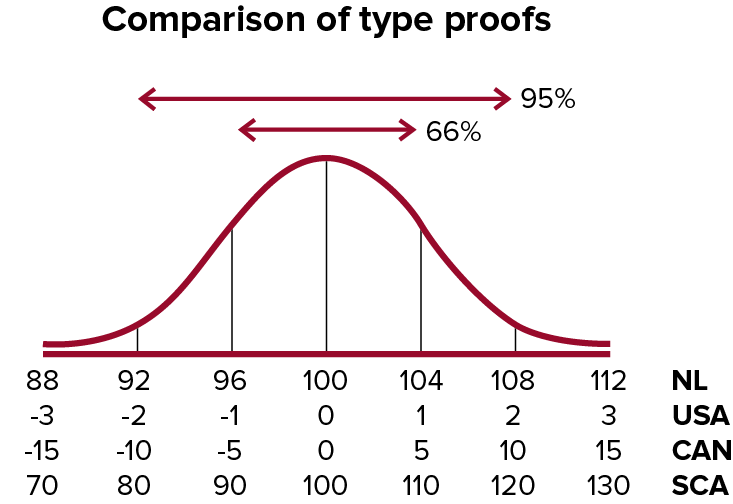
Understanding Dutch type proofs is not as difficult as you might think. The values and ranges of the Dutch proofs maybe look different from what you are used to, but if you compare them to US, Canadian and German proofs they are quite easy to understand. The graph shows the ranges of the proofs in the four different countries. For example, a bull with a breeding value of 108 on the Dutch scale is comparable with a US bull at +2.00 PTAT or a Canadian bull at +10 Conformation.
As you can see from the distribution of the indexes, 95% of the bulls have breeding values between 92 and 108. This means that bulls with a proof over 108 represent the top 2.5% of the breed.
This principle applies to any of the Dutch type traits, both the linears and the composites, and also to the Dutch proofs for management and health traits like udder health, and fertility.
According to CRV conformation is built up in frame, dairy strength, udder and feet & legs. The MRY breed is also scored on muscularity. In addition, udder and feet & legs are incorporated in the NVI. Using a sire with a breeding value of 112 for udder or feet & legs on a cow with a breeding value of 100 leads to an increase of 2.0 and 1.2 points on the classification scale, respectively.
Longevity
High longevity means less culling, lower rearing costs and above all higher lifetime yields. The average score for longevity is 0 and is expressed in days. The standard deviation is 270 days.
- Bulls with a longevity breeding value > 0 have daughters with high longevity, staying longer in the herd
- Bulls with a longevity breeding value < 0 have daughters with below average longevity. On average cows are culled earlier.
Every point for longevity above 0 increases the average longevity of the bull’s daughters with 0.5 days. So if the bull of your choice has a longevity of 500 days, this means that his daughters will be on average 250 days longer in production.
Longevity is comparable to the US Productive Life.
Birth Index
This index is made up of all the traits that influence the birth of the calf and are influenced by the dam and the calf itself.
Costs that are accounted for are reduced production due to difficult calving, reduced fertility, early culling and veterinary costs. In particular, the potential loss of the calf is a significant cost item.
The traits corresponding to the birth index include:
- Calving ease (paternal)
- Maternal calving process (MCP)
- Vitality (paternal)
- Maternal vitality
Using a bull with a breeding value for calving ease and MCP of 104 on a cow with a breeding value of 100 will result in around 1.8% less difficult births in heifers and the combination of the same bull with the older cows will produce around 0.9% less difficult births. For breeding values under 100, the opposite applies: namely more difficult births, shorter gestation length and lower birth weight.
In addition, there is also a clear difference between heifers and higher parities regarding the paternal and maternal vitality. A sire with a breeding value of 104 for paternal (direct) vitality means that heifers will have around 3.2% more live-born calves from a bull and the combination of the same bull with older cows will give around 0.7% more live-born calves from the same bull. A sire with a breeding value of 104 for maternal vitality means that the female offspring of a bull will have 4.8% more live-born calves as heifers and 0.6% more live-born calves as older cows.
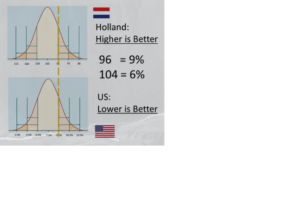
CALVING EASE EXAMPLE: DUTCH VERSUS U.S.
How do you interpret a 104 breeding value to the U.S. scale for Calving Ease?
Dutch
• Average Sire Calving Ease Breeding Value = 100
• Standard Deviation = 4
U.S.
• Average Sire Calving Ease Breeding = 7.5%
• Standard Deviation = 1.5
A standard deviation of 4 for Calving Ease in Holland
is the same as 1.5 in the U.S. Non-standardized averages in both countries are the same. See below.
